Reducing Bondora Default Rates Using the Portfolio Manager
Hi,
I’m Brett, and in this article I’ll present some findings from an analysis on a Bondora Loan dataset I did back in 2014.
Note: this article is a little dated now. However I have been using my research in 2019 so hopefully someone will find it useful. Leave a comment if you have anything to say!
Bondora is a P2P Lending Platform where you can potentially earn up to 25% interest a year. That pretty much beats any other bank account, stock or BTL property you’re ever likely to put money into.
The downside? Loan default rates are very high and there is an additional currency risk if (like me) your main income isn’t in Euros.
However, if you know what you’re doing, then it’s theoretically possible to make very good returns on Bondora.
One way of potentially increasing returns on P2P lending platforms is by profiling borrower default rates, and only lending to those who are statistically less likely to default on their loans.
This is where Bondora has a big advantage over other P2P lenders – they make their historic loan data available for analysis.
In this article I’ll run through some VERY basic credit analysis I did on the dataset I downloaded on 3 November 2014. See towards the end of the article for exactly how I did the analysis.
The Bondora loan dataset contains dozens of columns of data about each loan. In this article I have focused purely on the factors that are available to lenders who want to set up Portfolio Managers to automate the buying of loan parts.
This is the basic Portfolio Manager:
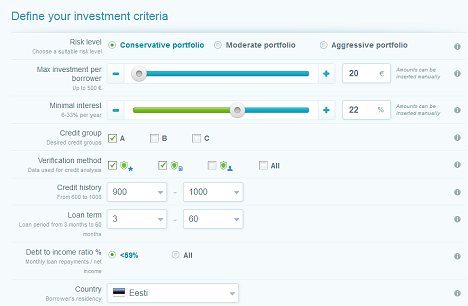
See below for some basic analysis on each factor, and whether it’s actually useful for reducing the risk of a default.
Credit Group
Bondora borrowers are assigned one of three Credit Groups: A, B or C.
Surprisingly, I found an inverse relationship between credit group and default rate:
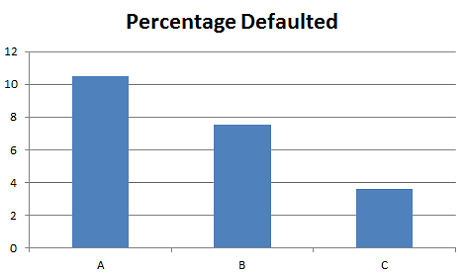
One thing to bear in mind is that there are far less “C” than “B” or “A” rated borrowers. In my sample data there were 6895 “A” loans, 1090 “B” loans and only 419 “C” loans.
So there may simply be less reliable data for the “C” loans.
My experiences with Zopa do suggest though that credit rating is not that great a future indicator of the possibility of a borrower defaulting. Most of my Zopa defaults were actually in the “A” credit group, and my “B” and “C” loans fared surprisingly well.
Verification Type
This factor specifies how Bondora verified the borrower’s income and expenditure. The four options for this are:
- Income unverified
- Income unverified, cross-referenced by phone
- Income verified
- Income and expenses verified
I’m a bit puzzled by my results from this query:
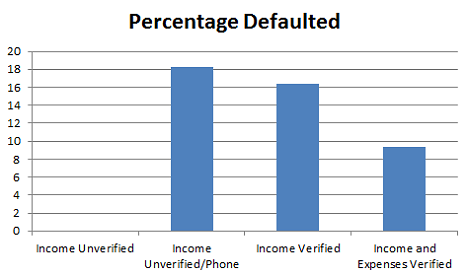
According to my analysis, no borrowers with unverified income have defaulted. Hmmm. If you have an explanation, then please do leave your comments at the end of this article.
Aside from this oddity, the rest of the data appears more reliable. Loans where the borrowers have had both their income and expenses verified appear half as likely to go into default compared to loans where only the borrower’s income has been verified.
When setting up my Portfolio Managers I would definitely prefer to select only loans where the borrower’s income and expenses have both been verified. But then so does everybody else…
Credit History
A borrower’s is assigned a Credit History score according to how recently they had problems making repayments on a loan. Bondora scores credit history from 500 – 1000, the criteria being:
- 1000: No previous payments problems
- 900: Payments problems resolved 24-36 months ago
- 800: Payments problems resolved 12-24 months ago
- 700: Payments problems resolved 6-12 months ago
- 600: Payment problems resolved <6 months ago
- 500: Borrower has active payment problems
The chart shows that in general, the higher the borrower’s credit history, the lower the chance of default:
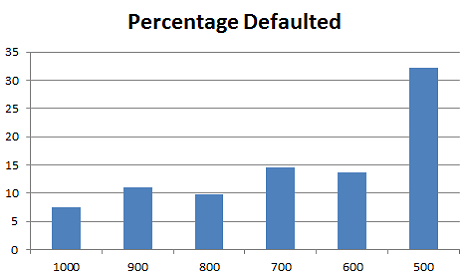
This chart also shows that there’s a much higher chance of default for the 500 credit history borrowers.
Canny lenders might infer from this chart that borrowers in the 800 credit history group might be worth a chance.
Loan Term
The Loan Term factor expresses how long the loan is for, in months.
I’m not sure how useful this factor is when using Bondora, as most loans these days seem to be for 60 months (i.e. 5 years) duration.
Anyway, here’s the chart of loan default rates against loan term:
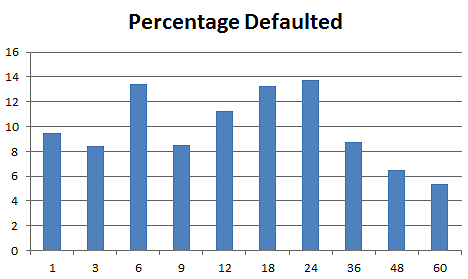
Personally I’d prefer to lend for 36 months rather than 60 months. This is because my experience with Zopa was that most of my bad loans only went into default after 3 years.
I guess this is because most borrowers who end up defaulting on a loan do so because of a drastic change in life circumstance (e.g. sickness, losing their job, divorce). And it’s much more likely that somebody will have such an unforeseen event happen in 3 or 4 years time, rather than in the first few months after they take out their loan.
Debt to Income Ratio
The Bondora Portfolio Manager allows you to only select loans where the borrower’s Debt to Income Ratio is less than 59%.
How useful is this ratio?
Not very!
I’m not too sure if debt to income ratio is a worthwhile inclusion on the portfolio manager.
In my database I could only find 105 loan applications where the debt to income ratio was greater than 59%. Most borrowers have a debt to income ratio of far less than 59%.
By plotting defaults against debt to income ratio, it appears that if anything, loan defaults are slightly lower at higher debt to income ratios.
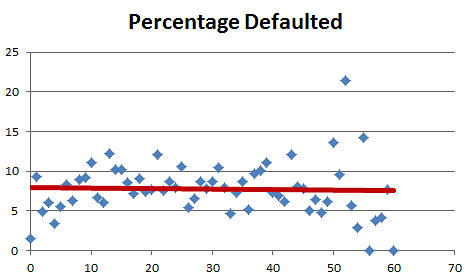
But again, this Portfolio Manager option appears to be of limited use.
Country
Bondora started off operating in Estonia, but has now started offering loans to people in Spain, Finland and Slovakia.
This analysis comes with a disclaimer – Bondora hasn’t been operating in the other three countries for as long as it has in Estonia, so the default rates for the other counties may rise significantly over time.
The loan defaults by country chart is below:
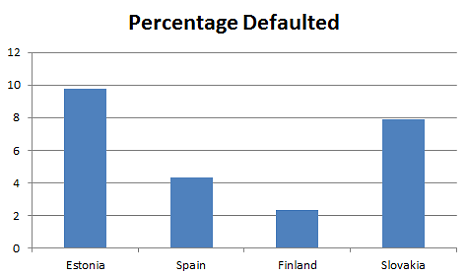
Most Bondora lenders prefer to lend to Estonian borrowers. This appears to be because Bondora has a good record of chasing late loans in that country.
Slovakia appears to be a particularly high risk country to invest in P2P loans through Bondora.
Both Spain and Finland appear to offer opportunities. Clearly more analysis is required here. But Estonian loans are becoming harder to come by on Bondora, so more lenders are interested in diversification into other countries, especially those with more than €5,000 to invest.
Min Interest
As can be seen in the chart below, there’s a pretty good relationship between loan interest rate and the chance of a default happening:
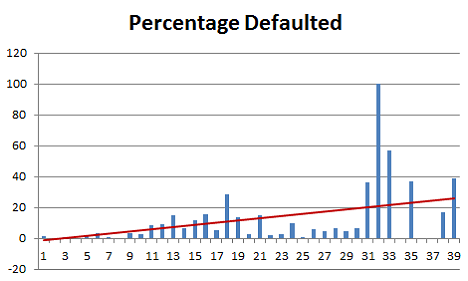
This is likely due to two factors:
- Higher risk borrowers are charged a higher rate of interest due to their risk profile.
- Loans with higher rates of interest are more of a financial burden on the borrower.
Incidentally, in the chart above I’ve left out the data for the few borrowers borrowing at less than 10%. There were only 38 loans in this category, and no defaults.
Data Generation
To generate this data, I used the following process:
- I downloaded the loan Excel spreadsheet from Bondora.
- I imported the Excel spreadsheet into SQL Server.
- I wrote some custom SQL queries to analyse the data.
- I exported the results sets from SQL Server back into Excel in order to turn them into charts.
I have assumed that the AD column equaling 1 indicates that a loan has defaulted. I have excluded loans that were applied for within the last 3 months or so. Finally, I’ve only included Estonian loans in all the queries except for the one relating to country.
If you want to have a go at analysing the data yourself, then this is the basic SQL query I used:
SELECT
CreditGroup,
(Sum(AD) / Count(*) * 100) AS ‘Percentage Defaulted’,
SUM(AD) as NumberInDefault,
COUNT(*) as NumberOfLoans
From Loans
WHERE country = ‘EE’ AND creditdecision = 1
AND CreditGroup IS NOT null
AND LoanApplicationStartedDate < ‘2014-10-27’
GROUP BY CreditGroup
ORDER BY CreditGroup
Summary and Conclusions
Avoid Slovakia and borrowers with a 500 credit history score? That seems to be the main findings of my number crunching in SQL Server.
I have to say that if you want to fine tune your portfolio’s risk of default, then the Portfolio isn’t really the best place to do that.
In order to really reduce your potential default rates, you need much more control over your loan buying, and that just isn’t possible using the basic settings within the Portfolio Manager.
In a future post I’ll cover some of the factors that are much better indicators of future potential default rates! I hope to also cover some different tools for analysing the loan data. SQL Server is good, but there are plenty of other tools that can also give great results with this data.
One last thing… There is one other factor that I haven’t mentioned in the analysis here, but is an important consideration for the Portfolio Manager. When investing in a P2P platform it’s generally better to invest €5 in 20 different loans, than invest the entire €100 in a single loan. Eggs and baskets and all that. So bear that in mind when you come to configure your Portfolio Manager.
Comments? Questions? Suggestions? Leave feedback below!
2019 update: this article is a little dated now. However I have been using this data in 2019 to buy secondary market loans that I hope will make me a good return. Let me know if you’ve also found it useful, or if you have any tips on how to make stellar returns on Bondora!
Overall, it good analysis.
Something to keep in mind – the 500 credit score no longer exists as of I think about 3 years ago? They used to use it way back when Bondora started but it's no longer in use since people who would get the 500 credit score are no longer eligible at all for loans at Bondora.
The default rates for Estonian loans also seem a bit high, but I'm unsure as to what is the reason for that.
While it's great to see that more people are doing analyses on the dataset, you have clearly made several mistakes in your analyses processes.
Some of them are even rather common among the investors who try crunching the dataset.
For this reason I started a blog post series where I'll try to explain the different nuances you should account for when doing such calculations.
Based on the upcoming fourth post you should also be able to understand your result for data verification method analyses.